
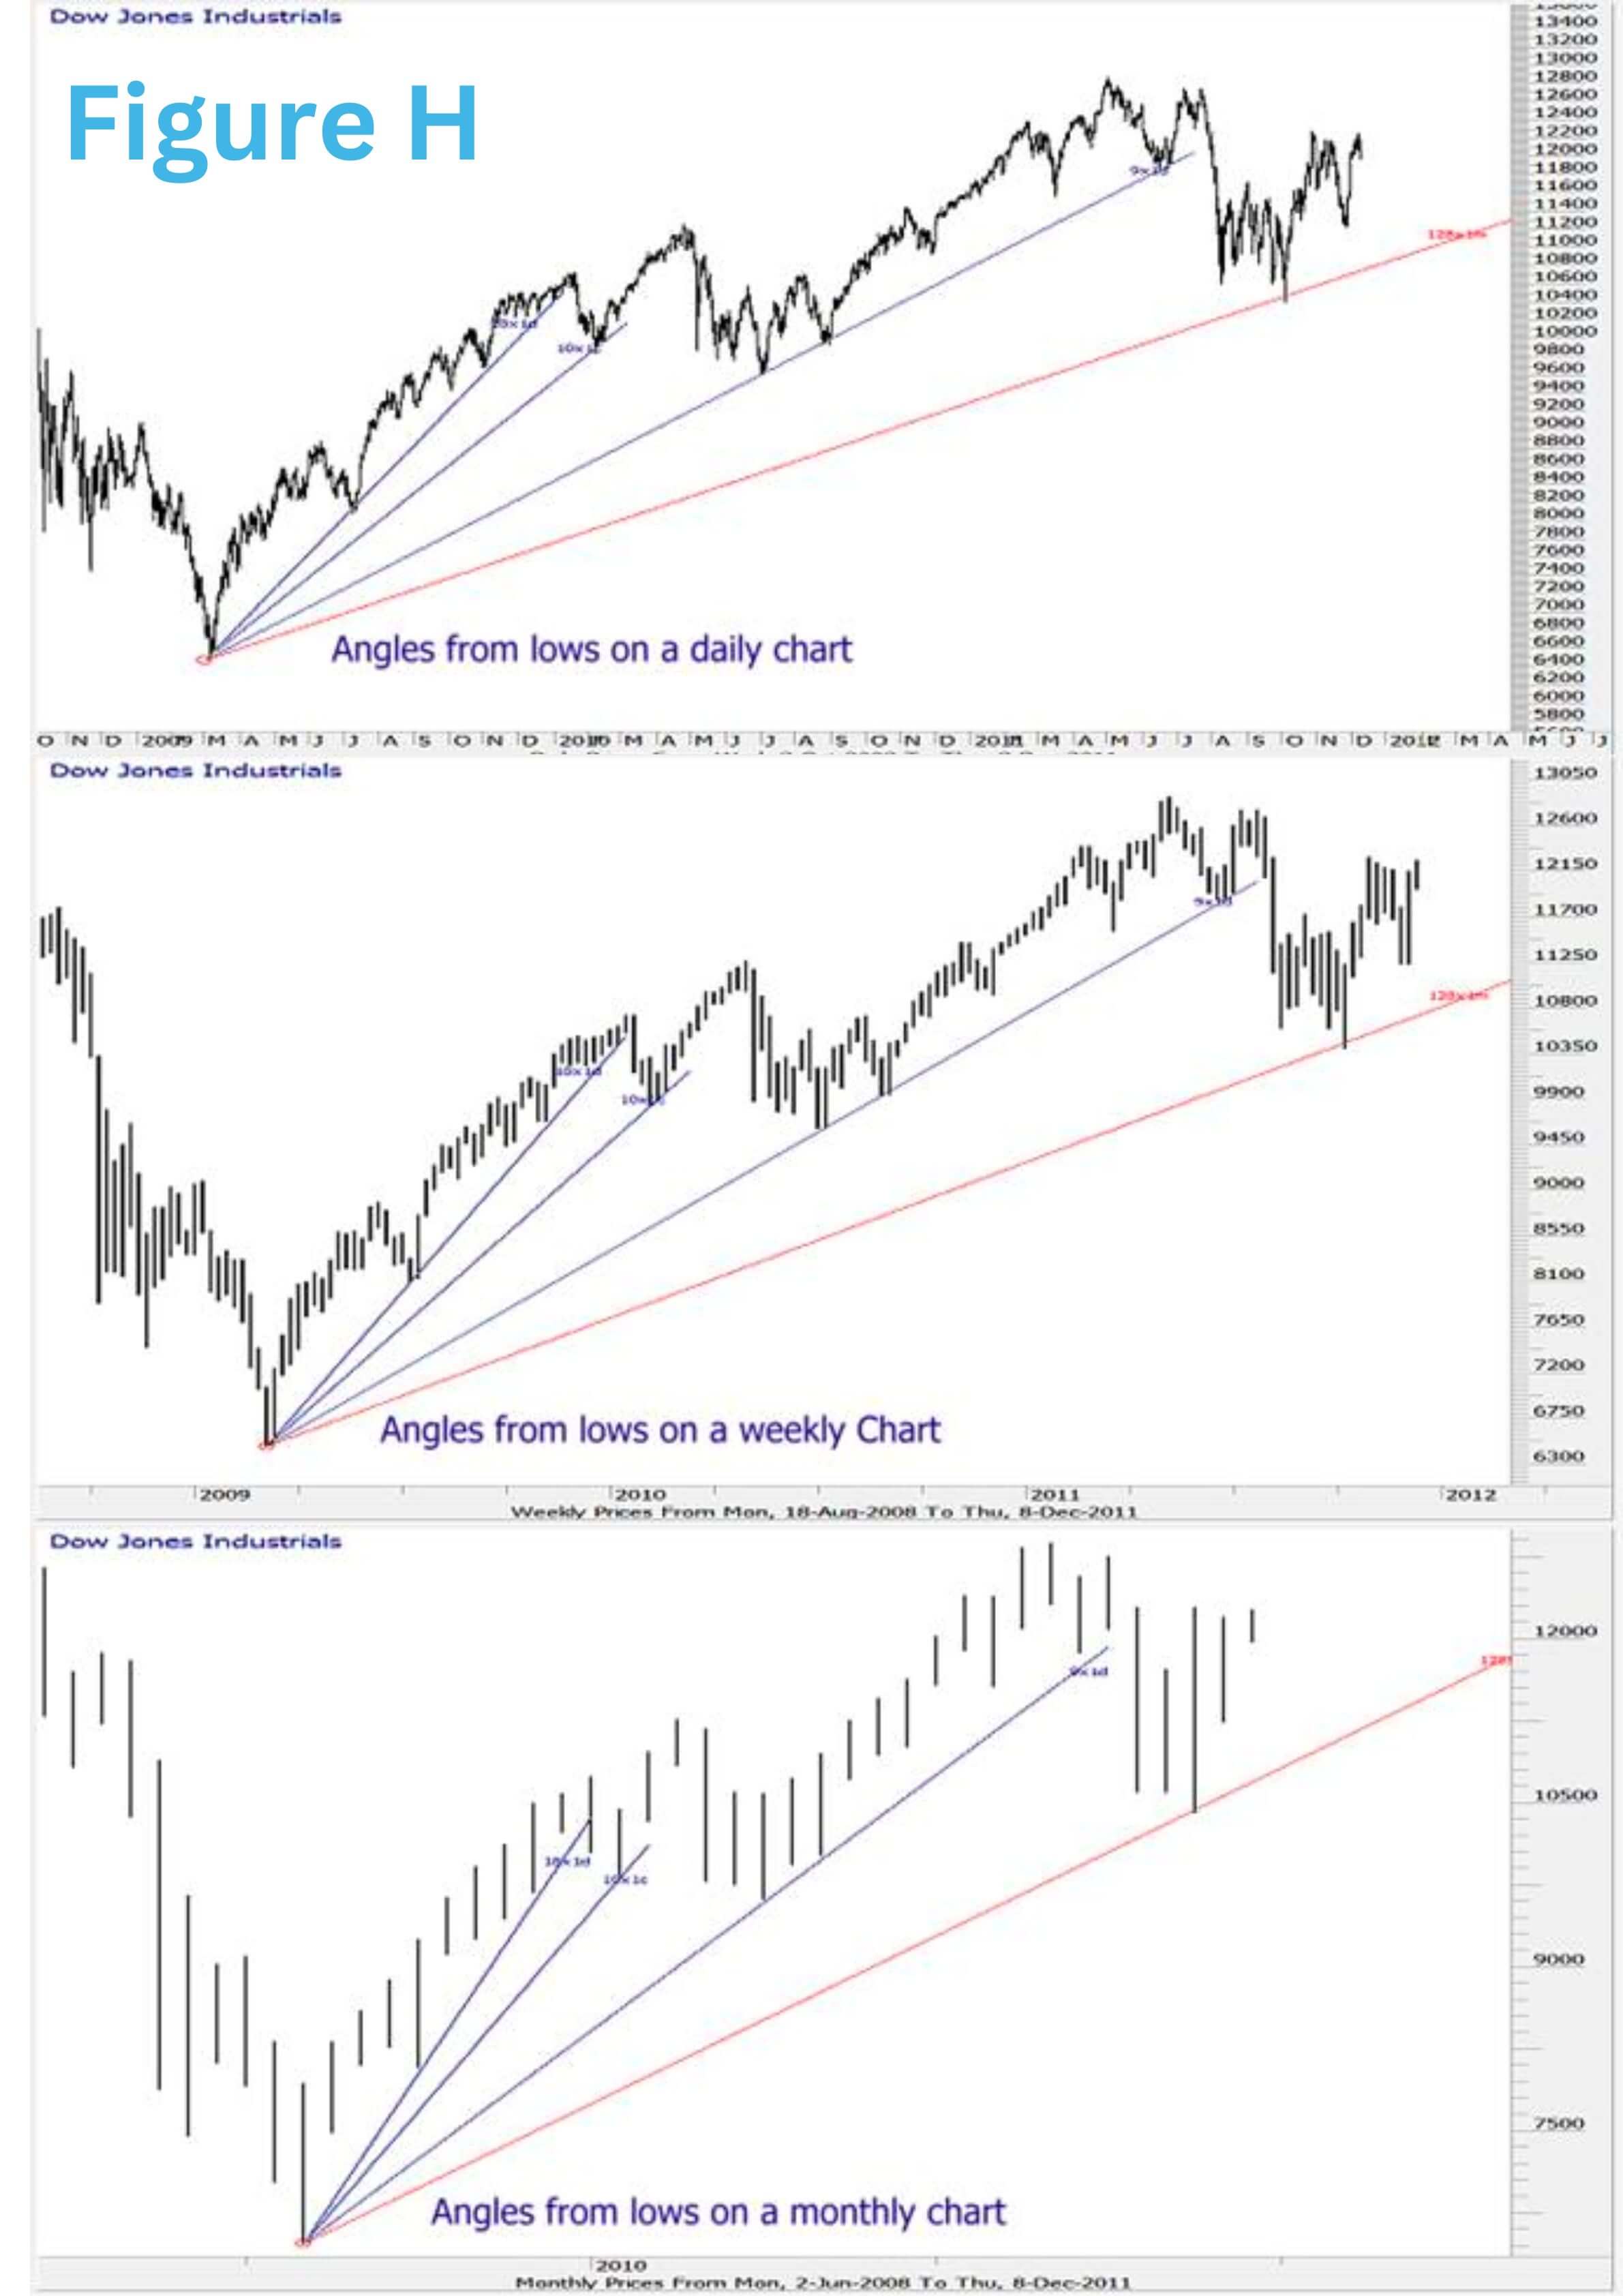
ANGLES FROM LOWS
(See Figure H)
Gann Angles are trend lines or lines of resistance which take both time and price into account.
They are drawn from important tops and bottoms and can be applied on long term monthly and weekly graphs and short term daily graphs. An Angle taken from a bottom which occurred many years ago can be very relevant to the current price action.
If a Gann Angle is broken on the upside, then higher prices are indicated.
If the Gann Angle is broken on the downside, then lower prices are indicated.
Constructions of Angles
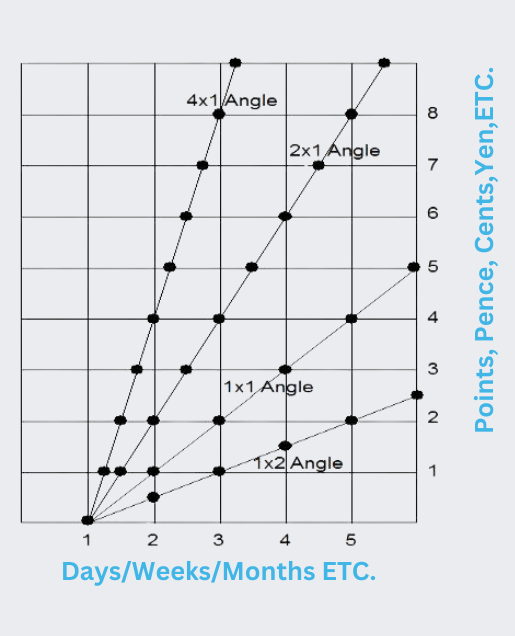
Imagine a Balanced Graph like to one shown.
The time scale is the horizontal axis and this could be days, weeks or months. The price scale is the vertical axis. This could be Pence, Cents, Dollars, Yen, Francs, or points etc.
If you were to draw a line which rises 1 point per week from the lowest point of a ‘bottom’, you would be creating a 45 degree Angle. For a steeper Angle you would draw a line which rises 2 points per week, then 4 points per week, then 8 points per week, etc.
For a shallower Angle you would draw a line rising 1/2 point per week, which translated onto the computer would be 1 point every 2 weeks, then 1 point every 4 weeks, etc.
THE APPLICATION OF GANN ANGLES
Once a Gann Angle is broken on the downside, the price will generally, eventually reach the next Angle below. Once an Angle is broken on the upside, the price will generally, eventually reach the next Angle above.
Gann Angles are as follows:-
1 point per 1 day, week or month
2 points per 1 day, week or month
* If necessary 3 points per day, week or month
4 points per 1 day, week or month
* If necessary 6 points per day, week or month
8 points per day, week or month
Etc.
* As a price moves further away from the source of a controlling Angle, trading can become more volatile and on occasion it may be necessary to split the Angles in order to ascertain where shorter term reactions might occur. On these occasions the 3 by 1, 6 x 1 and 12 x 1 etc Angles may be used.
Gann Angles can also be drawn DOWN from lows to ascertain where later, ‘lower lows’ or ‘lower highs’ might occur.
YOU WOULD NOT NECESSARILY USE GANN TIMING ANGLES ALONE TO GIVE SIGNALS TO BUY OR SELL SHORT - BUT THEY ARE ONE OF THE MOST ACCURATE AND IMPORTANT OF GANN’S INVESTMENT TECHNIQUES.
You will often see a share track sideways to meet the next Angle, rather than falling straight down to it, at which point it can often move fast in either direction after touching the Angle it has been travelling to meet. If the Angle is broken there are usually lower prices ahead.
If ever a long term 1 by 1 Angle from an all time low is broken then the share price can be considered to be in serious difficulties - until (and if) the Angle is recovered.
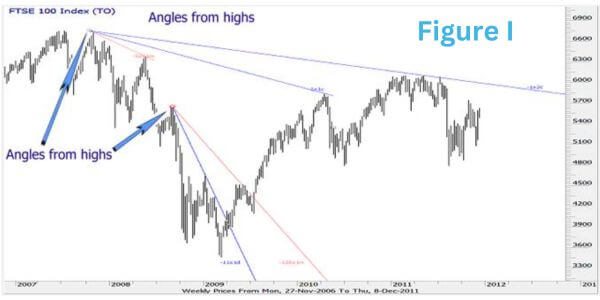
GANN ANGLES FROM HIGHS
(See Figure I)
The principles, construction and application of Gann Angles from highs is exactly the same as those for Angles from lows.
You simply draw the Angles DOWN from highs i.e. MINUS 1 point etc. per day, week or month from the highest point in the peak. You can of course draw Angles UP from highs too, but these are used less frequently.
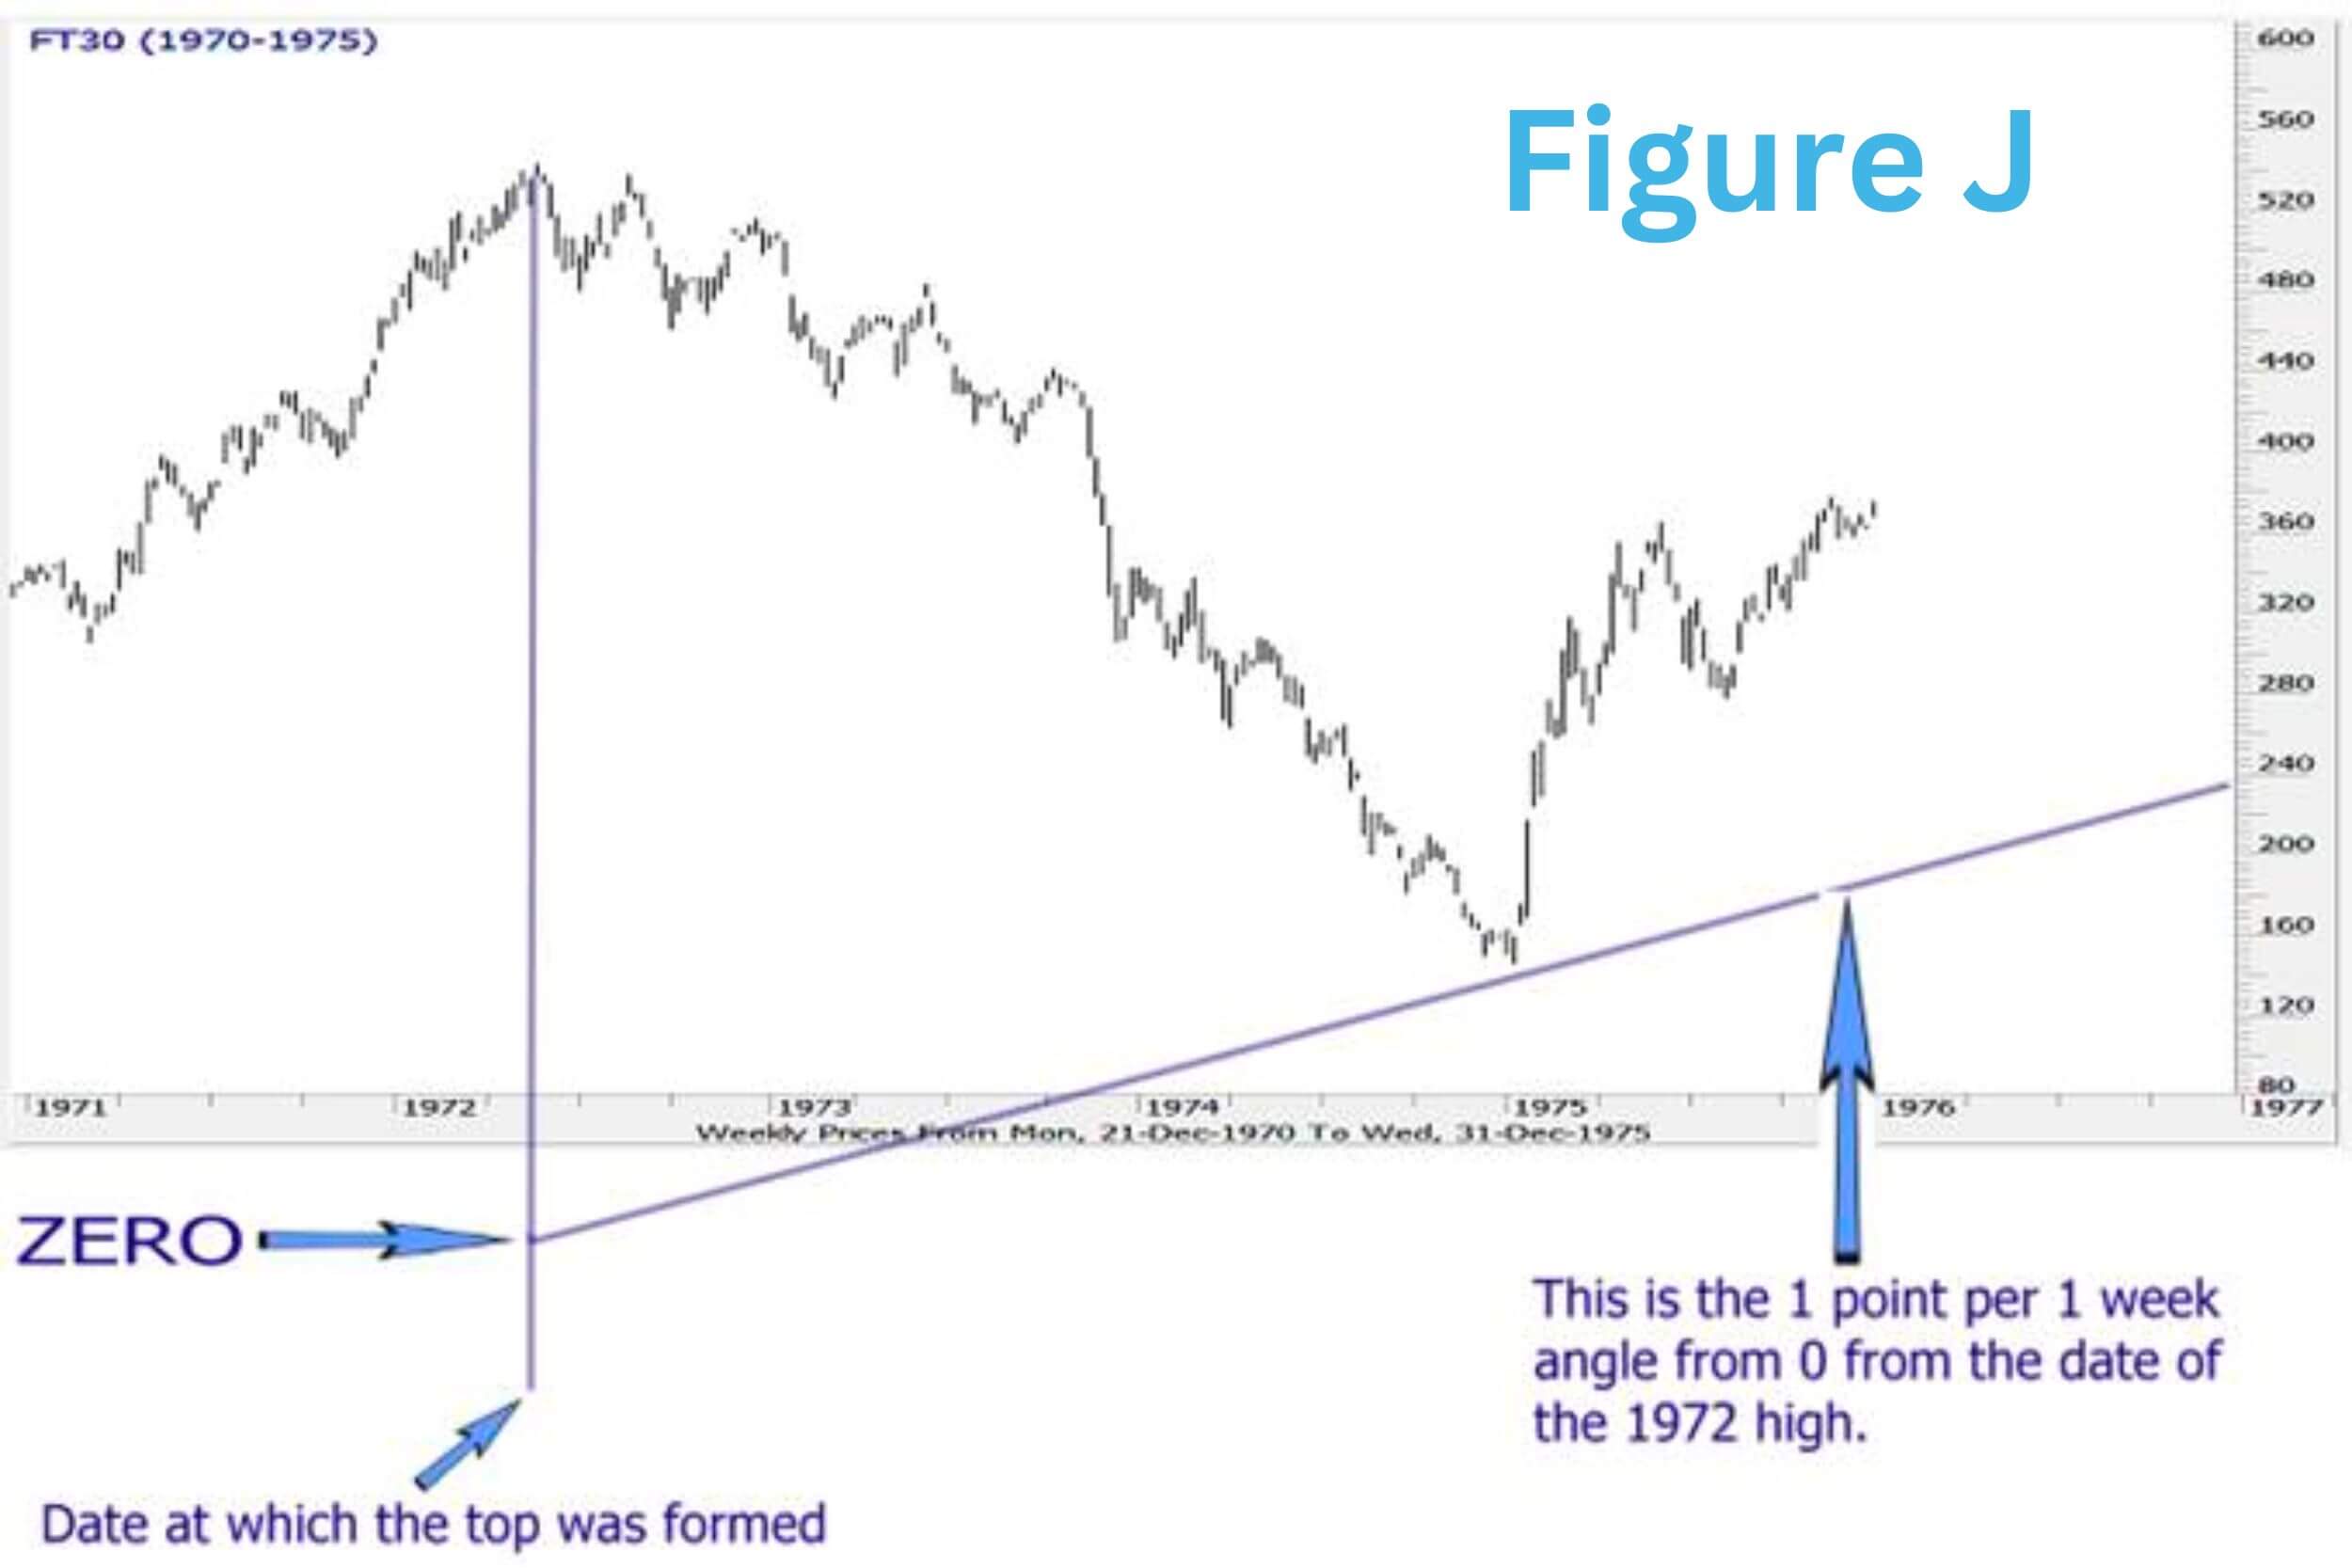
ANGLES FROM ZERO
See Figure J
Angles of resistance, which are similar to Angles from lows.
ConstructionThese Angles are of the same nature and construction as Angles from lows but drawn from Zero.
These Angles are drawn using the DATE of a major high or low and in particular from the date of the Extreme high or low.
Instead of drawing the Angle up from the low, the start point of the Angle is at Zero - from the same date as the high or low.
The effect on the IDS software is that you will often see Angles coming up from below the start of the graph, indeed in some cases Zero may be so far down, that shallow Angles drawn from there do not appear on the screen.
The ApplicationAngles from Zero can, in many cases, give indications of where tops and bottoms during major moves might occur. They are particularly helpful when a price is in new low ground and there are no previous ‘lower lows’ from which to draw any supporting Angles from.
There is nothing new in the following text. The idea that I am trying to impress is that nothing does not work. It may look as though it has not worked, but the price is just telling you what it is most likely to do next. Also, if an Angle is not working almost exactly then it is not working at all and should not be used in the future. All the rules below are designed to take away the need for hindsight and allow you to remove Angles which you know with a strong degree of accuracy will not work in the future. I believe that this is the most important thing I have discovered. It is very important that lines are removed when they become obsolete.
Keep in mind
Angles are the most important thing to consider. You are using the correct Angles only if they work almost exactly. Knowing the correct Angle sequence is important. Never fit things in because it suits what you are trying to see.
Angles to use
All tops and bottoms work to their own individual set of Angles. Angle ‘sets’ are split up into two main categories, and each main category is then split into two sub-categories.
Main category
The main category refers to the time period to use. The time period can only be days or weeks in most cases. Only if you find neither of these working should you use monthly Angles.
In my experience I rarely need to use monthly Angles from a particular high or low. As a very general rule you will find that from ALL TIME lows and highs, daily Angles work the best. From major highs and lows weekly Angles work the best, and from minor tops and bottoms the daily Angles are better. These are general guidelines and I will give more accurate rules later.
Monthly Angles may seem to work because they are very close to daily Angles (especially the halfway monthly Angles), but you should not use them as over time it can make a great deal of difference and you will not get the next low or high exactly.
Sub-categoryThe sub-category is the Angle progression to use. There are only two progressions and these are:-
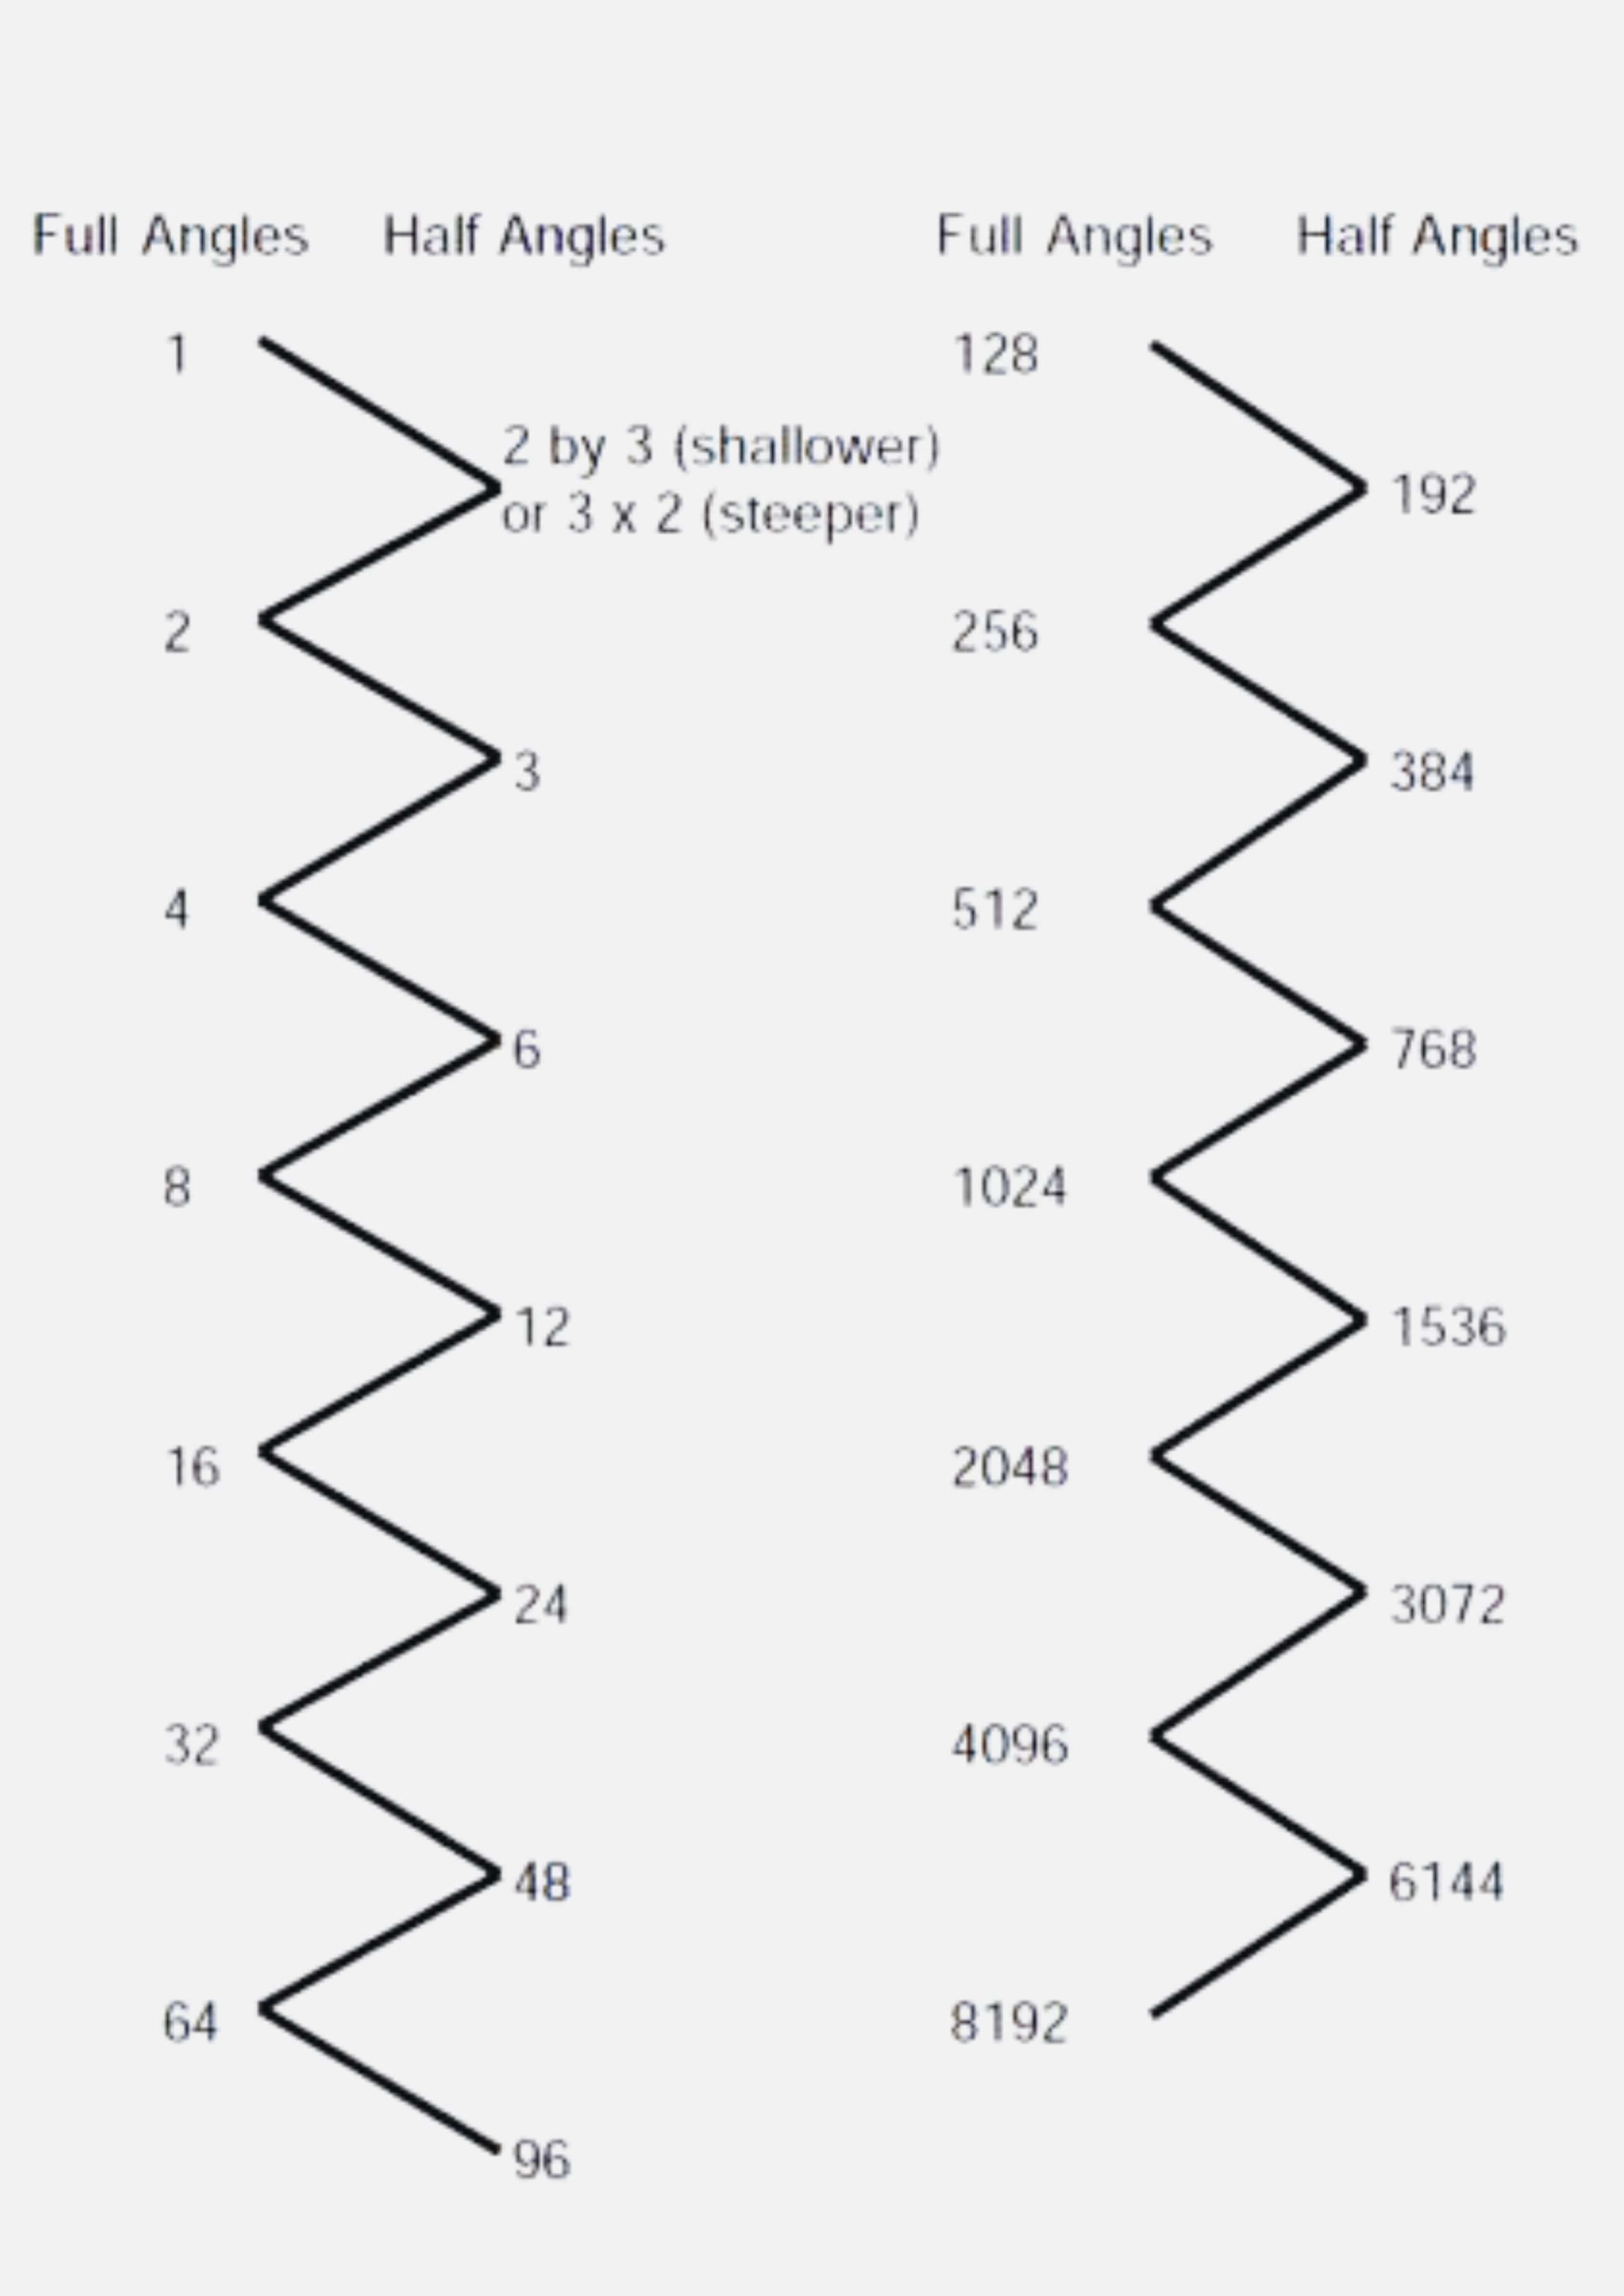
Full Gann Angles
1x8, 1x4, 1x2, (1x1), 2x1, 4x1 8x1, 16x1, 32x1, 64x1, 128x1, 256x1, etc.
OR
Half Angles
1x12, 1x6, 1x3, 2x3, 3x2, 3x1, 6x1, 12x1, 24x1, 48x1, 96x1, 192x1, 384x1, etc.
I never use 10x1, 20x1, etc. or 1x100, 1x200, etc. They will look like they work, especially the multiples of ten on a weekly chart, because all you are doing is drawing daily Angles on a weekly chart. e.g. A 5x1 on a weekly chart is a 1x1 daily Angle, a 10x1 weekly is a 2x1 daily Angle.
The multiples of a hundred are the bigger problems as they are slightly ‘out’. e.g. 1x100 is very close to the 1x96 and the 1x200 to the 1x192.
Over time this can make a great difference. In the vast majority of cases I have found that Angles if used correctly will work almost, if not exactly to the price unit.
I must stress, Gann Angles will work exactly if you are using the correct progression. If the Angles are not working exactly then you are probably not using the correct Angles. If you have difficulty finding the correct Angles, then ignore this top or bottom until hindsight provides the answer.
Gann Angles to use
You can usually find the correct Angles when a low is made in about 1 to 3 weeks. Find out what the first reaction is made on. Is it a weekly or a daily Angle? A full Angle (1x1, 2x1, 4x1), etc? Or a half Angle (2x3, 1x3, 1x6), etc? To start off with this can be difficult because daily full Angles are very similar to weekly Angles. This gets easier with experience. Further time will resolve this problem. If you have made a mistake then change the Angle or you will not get the exact tops and bottoms in the future.
A problem
When drawing Angles on a monthly chart, the computer does not know the exact date in the month on which the high or low was made. It assumes that the high or low was made on the 1st of the month. This makes finding the first reaction difficult on a monthly chart if the low was made near the end of the month. This problem is offset by the hindsight that a monthly affords you. However, always draw Angles on the daily or weekly chart wherever possible.
Where to draw Gann Angles from?
Always draw Angles from where the movement starts from. e.g. From a double top draw the Angles from the second top regardless of whether it is lower or not. From triple tops take the third top, etc.
If a major high is formed, followed by a secondary top, then draw the Angles from the major high until the Angles are steeper than the secondary high. Then draw the steeper Angles from the secondary top. If the Angles from the major high were daily then the Angles from the secondary top should also be daily (in most cases, but not all). If full Angles from the first high are working then from the secondary high you tend to find that half Angles will work. Reverse these rules for bottoms.
What Gann Angles are telling you?
I look to buy on falling to rising Angles from lows. I ignore rising to rising Angles from lows. I have found that if the daily Angles are giving you the lows to buy from, then weekly Angles from the same low tend to give you tops, and vice versa. But do not draw both sets of Angles as it just confuses things. In other words do not consider that the Angles you are drawing are working if they are giving you tops, as they don’t tend to give you bottoms.
I look to sell or short on rising to falling Angles from highs. Again, I ignore falling to falling Angles from highs.
I look to sell on rising to rising Angles from highs.
I look to buy on falling to falling Angles from lows.
I am not saying that rising to rising Angles from lows do not give highs, but there are much better ways of finding these highs. Also it helps you to see a much clearer graph because you can remove all the Angles that are steeper than the prices. This gives increased confidence in a signal, as you can remove most of the Angles.
When to change Gann Angles
If you have found that a low or high is working to daily Gann Angles then you can only draw daily Angles from this low. Do the same with weekly and monthly Angles.
However, there are times when you need to change from full Angles, e.g. (1x1, 2x1, 4x1) etc. To half Angles e.g. (3x2, 3x1, 6x1) etc, from the same low or high.
Example If the share price makes its first reaction on a daily 8x1 Angle, with the prices trading up this Angle. When the price falls below you would expect the price to reach the next Angle of the 4x1. But if, when the price reaches the 4x1 the price shows no change in trend and falls through, then the next major Angle will not be the 2x1, but the Angle halfway between the 4x1 and the 2x1 - which is the 3x1. From this point onwards you only use half Angles below the 3x1. Do exactly the same if a half Angle is broken with no change in trend - i.e. go back to full Angles.
Example If the price showed no change in trend on the above mentioned 3x1 then the next Angle to watch would be the 2x1, not the 3x2. With the Angle, below the 2x1 to use being the 1x1.
Fast Moves
There are two points at which you would expect fast moves to take place. The first happens if full Gann Angles are working and the price stops on a halfway Angle exactly. Watch for strength here as this is normally the start of a fast sharp movement. Reverse the rule in a bear market.
The second place to watch for fast movements is if a price falls below its Angle, but then regains it, without first reaching the next Angle below. The market will normally come back to the Gann Angle it regained to give you a second chance to buy, and normally this is the start of a fast sharp movement. Again, reverse this rule in a falling market.
Figure Example is an ‘AIDE-MEMOIRE’ of the correct angles to use
Your Investments, Your Schedule. Optimise your financial strategy anytime, anywhere with Gann Analytics.